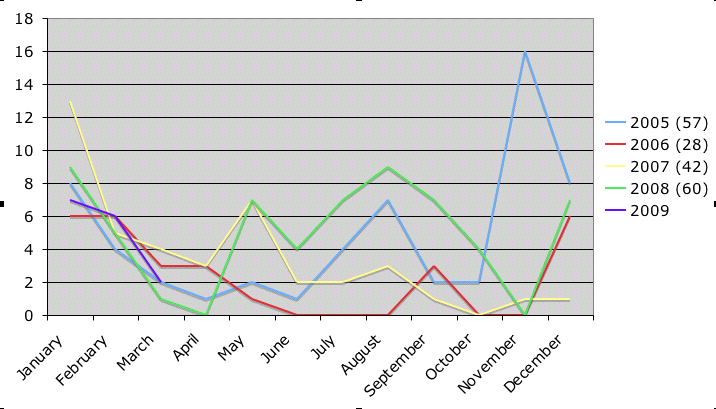
Quite interesting! It's not tons of data, but I think it's pretty safe to say that I have consistently experienced a big dropoff in the spring. I wonder why? There is a similar trend in the fall as well, with a surge at the end of the year. I think the one big lesson I can take out of this is to push hard to be very consistent across the summer. Those dropoffs in spring and fall seem to be some kind of profound psychological issues that will take a lot of deep therapy to overcome and thus not so easy to change. But if you look at the years where I did really well (2005 and 2008), I was strong throughout the summer. The year where I blew it, I had a very unproductive summer. I need to go back and figure out what happened that summer. It seems that the summer is a period where I have some control over my character and thus the outcome of my 50-book challenge.
This is like the Moneyball of 50 books! Improving performance through advanced statistical analysis.


2 comments:
I love these kind of feedback loops. It looks like you also have minor spikes around May/June and August.
I like the big push at the end of the year. I totally understand the summer drop off. For me I'd have to find ways to read outdoors... and stay focused.
Post a Comment